This guide is a companion to the Building a Native Executable, Using SSL With Native Images, and Writing Native Applications, guides. It provides further details to debugging issues in Quarkus native executables that might arise during development or production.
This reference guide takes as input the application developed in the Getting Started Guide. You can find instructions on how to quickly set up this application in this guide.
Requirements and Assumptions
This guide has the following requirements:
-
JDK 11 installed with
JAVA_HOMEconfigured appropriately -
Apache Maven 3.8.4
-
A working container runtime (Docker, podman)
This guide builds and executes Quarkus native executables within a Linux environment. To offer a homogeneous experience across all environments, the guide relies on a container runtime environment to build and run the native executables. The instructions below use Docker as example, but very similar commands should work on alternative container runtimes, e.g. podman.
|
Building native executables is an expensive process, so make sure the container runtime has enough CPU and memory to do this. A minimum of 4 CPUs and 4GB of memory is required. |
Finally, this guide assumes the use of the Mandrel distribution of GraalVM for building native executables, and these are built within a container so there is no need for installing Mandrel on the host.
Bootstrapping the project
Start by creating a new Quarkus project. Open a terminal and run the following command:
For Linux & MacOS users
For Windows users
-
If using cmd , (don’t use backward slash
\and put everything on the same line) -
If using Powershell , wrap
-Dparameters in double quotes e.g."-DprojectArtifactId=debugging-native"
Configure Quarkus properties
Some Quarkus configuration options will be used constantly throughout this guide,
so to help declutter command line invocations,
it’s recommended to add these options to the application.properties file.
So, go ahead and add the following options to that file:
quarkus.native.container-build=true
quarkus.native.builder-image=quay.io/quarkus/ubi-quarkus-mandrel:22.0-java11
quarkus.container-image.build=true
quarkus.container-image.group=test
First Debugging Steps
As a first step, change to the project directory and build the native executable for the application:
./mvnw package -DskipTests -PnativeRun the application to verify it works as expected. In one terminal:
docker run -i --rm -p 8080:8080 test/debugging-native:1.0.0-SNAPSHOTIn another:
curl -w '\n' http://localhost:8080/helloThe rest of this section explores ways to build the native executable with extra information,
but first, stop the running application.
We can obtain this information while building the native executable by adding additional native-image build options using -Dquarkus.native.additional-build-args, e.g.
./mvnw package -DskipTests -Pnative \
    -Dquarkus.native.additional-build-args=--native-image-info
Executing that will produce additional output lines like this:
...
# Printing compilation-target information to: /project/reports/target_info_20220223_100915.txt
…
# Printing native-library information to: /project/reports/native_library_info_20220223_100925.txt
The target info file contains information such as the target platform, the toolchain used to compile the executable, and the C library in use:
$ cat target/*/reports/target_info_*.txt
Building image for target platform: org.graalvm.nativeimage.Platform$LINUX_AMD64
Using native toolchain:
   Name: GNU project C and C++ compiler (gcc)
   Vendor: redhat
   Version: 8.5.0
   Target architecture: x86_64
   Path: /usr/bin/gcc
Using CLibrary: com.oracle.svm.core.posix.linux.libc.GLib
The native library info file contains information on the static libraries added to the binary and the other libraries dynamically linked to the executable:
$ cat target/*/reports/native_library_info_*.txt
Static libraries:
   ../opt/mandrel/lib/svm/clibraries/linux-amd64/liblibchelper.a
   ../opt/mandrel/lib/static/linux-amd64/glibc/libnet.a
   ../opt/mandrel/lib/static/linux-amd64/glibc/libextnet.a
   ../opt/mandrel/lib/static/linux-amd64/glibc/libnio.a
   ../opt/mandrel/lib/static/linux-amd64/glibc/libjava.a
   ../opt/mandrel/lib/static/linux-amd64/glibc/libfdlibm.a
   ../opt/mandrel/lib/static/linux-amd64/glibc/libsunec.a
   ../opt/mandrel/lib/static/linux-amd64/glibc/libzip.a
   ../opt/mandrel/lib/svm/clibraries/linux-amd64/libjvm.a
Other libraries: stdc++,pthread,dl,z,rt
Even more detail can be obtained by passing in --verbose as an additional native-image build argument.
This option can be very useful in detecting whether the options that you pass at a high level via Quarkus are being passed down to the native executable production,
or whether some third party jar has some native-image configuration embedded in it that is reaching the native-image invocation:
./mvnw package -DskipTests -Pnative \
    -Dquarkus.native.additional-build-args=--verbose
Running with --verbose demonstrates how the native-image building process is two sequential java processes:
-
The first is a very short Java process that does some basic validation and builds the arguments for the second process (in a stock GraalVM distribution, this is executed as native code).
-
The second Java process is where the main part of the native executable production happens. The
--verboseoption shows the actual Java process executed. You could take the output and run it yourself.
One may also combine multiple native build options by separating with a comma, e.g.:
./mvnw package -DskipTests -Pnative \
-Dquarkus.native.additional-build-args=--native-image-info,--verbose|
Remember that if an argument for |
Inspecting Native Executables
Given a native executable, various Linux tools can be used to inspect it. To allow supporting a variety of environments, inspections will be done from within a Linux container. Let’s create a Linux container image with all the tools required for this guide:
FROM fedora:35

RUN dnf install -y \
binutils \
gdb \
git \
perf \
perl-open

ENV FG_HOME /opt/FlameGraph

RUN git clone https://github.com/brendangregg/FlameGraph $FG_HOME

WORKDIR /data

ENTRYPOINT /bin/bash
Using docker in the non-Linux environment, you can create an image using this Dockerfile via:
docker build -t fedora-tools:v1 .Then, go to the root of the project and run the Docker container we have just created as:
docker run -t -i --rm -v ${PWD}:/data -p 8080:8080 fedora-tools:v1ldd shows the shared library dependencies of an executable:
ldd ./target/debugging-native-1.0.0-SNAPSHOT-runnerstrings can be used to look for text messages inside the binary:
strings ./target/debugging-native-1.0.0-SNAPSHOT-runner | grep HelloUsing strings you can also get Mandrel information given the binary:
strings ./target/debugging-native-1.0.0-SNAPSHOT-runner | grep core.VMFinally, using readelf we can inspect different sections of the binary.
For example, we can see how the heap and text sections take most of binary:
readelf -SW ./target/debugging-native-1.0.0-SNAPSHOT-runnerNative Reports
Optionally, the native build process can generate reports that show what goes into the binary:
./mvnw package -DskipTests -Pnative \
    -Dquarkus.native.enable-reports
The reports will be created under target/debugging-native-1.0.0-SNAPSHOT-native-image-source-jar/reports/.
These reports are some of the most useful resources when encountering issues with missing methods/classes, or encountering forbidden methods by Mandrel.
Call Tree Reports
call_tree text file report is one of the default reports generated when the -Dquarkus.native.enable-reports option is passed in.
This is useful for getting an approximation on why a method/class is included in the binary.
However, the text format makes it very difficult to read and can take up a lot of space.
Since Mandrel 21.3.0.0, the call tree is also reported as a group of CSV files.
The CSV output can be enabled by adding -H:PrintAnalysisCallTreeType=CSV to the additional native arguments. E.g.
./mvnw package -DskipTests -Pnative \
    -Dquarkus.native.enable-reports \
    -Dquarkus.native.additional-build-args=-H:PrintAnalysisCallTreeType=CSV
These can in turn be imported into a graph database, such as Neo4j, to inspect them more easily and run queries against the call tree. Let’s see this in action.
First, start a Neo4j instance:
export NEO_PASS=...
docker run \
    --detach \
    --rm \
    --name testneo4j \
    -p7474:7474 -p7687:7687 \
    --env NEO4J_AUTH=neo4j/${NEO_PASS} \
    neo4j:latest
Once the container is running,
you can access the Neo4j browser.
Use neo4j as the username and the value of NEO_PASS as the password to log in.
To import the CSV files, we need the following cypher script which will import the data within the CSV files and create graph database nodes and edges:
CREATE CONSTRAINT unique_vm_id ON (v:VM) ASSERT v.vmId IS UNIQUE;
CREATE CONSTRAINT unique_method_id ON (m:Method) ASSERT m.methodId IS UNIQUE;

LOAD CSV WITH HEADERS FROM 'file:///reports/call_tree_vm.csv' AS row
MERGE (v:VM {vmId: row.Id, name: row.Name})
RETURN count(v);

LOAD CSV WITH HEADERS FROM 'file:///reports/call_tree_methods.csv' AS row
MERGE (m:Method {methodId: row.Id, name: row.Name, type: row.Type, parameters: row.Parameters, return: row.Return, display: row.Display})
RETURN count(m);

LOAD CSV WITH HEADERS FROM 'file:///reports/call_tree_virtual_methods.csv' AS row
MERGE (m:Method {methodId: row.Id, name: row.Name, type: row.Type, parameters: row.Parameters, return: row.Return, display: row.Display})
RETURN count(m);

LOAD CSV WITH HEADERS FROM 'file:///reports/call_tree_entry_points.csv' AS row
MATCH (m:Method {methodId: row.Id})
MATCH (v:VM {vmId: '0'})
MERGE (v)-[:ENTRY]->(m)
RETURN count(*);

LOAD CSV WITH HEADERS FROM 'file:///reports/call_tree_direct_edges.csv' AS row
MATCH (m1:Method {methodId: row.StartId})
MATCH (m2:Method {methodId: row.EndId})
MERGE (m1)-[:DIRECT {bci: row.BytecodeIndexes}]->(m2)
RETURN count(*);

LOAD CSV WITH HEADERS FROM 'file:///reports/call_tree_override_by_edges.csv' AS row
MATCH (m1:Method {methodId: row.StartId})
MATCH (m2:Method {methodId: row.EndId})
MERGE (m1)-[:OVERRIDEN_BY]->(m2)
RETURN count(*);

LOAD CSV WITH HEADERS FROM 'file:///reports/call_tree_virtual_edges.csv' AS row
MATCH (m1:Method {methodId: row.StartId})
MATCH (m2:Method {methodId: row.EndId})
MERGE (m1)-[:VIRTUAL {bci: row.BytecodeIndexes}]->(m2)
RETURN count(*);
Copy and paste the contents of the script into a file called import.cypher.
|
Mandrel 22.0.0 contains a bug where the symbolic links used by the import cypher file are not correctly set when generating reports within a container (for more details see here). This can be worked around by copying the following script into a file and executing it: |
Next, copy the import cypher script and CSV files into Neo4j’s import folder:
docker cp \
    target/*-native-image-source-jar/reports \
    testneo4j:/var/lib/neo4j/import

docker cp import.cypher testneo4j:/var/lib/neo4j
After copying all the files, invoke the import script:
docker exec testneo4j bin/cypher-shell -u neo4j -p ${NEO_PASS} -f import.cypherOnce the import completes (shouldn’t take more than a couple of minutes), go to the Neo4j browser, and you’ll be able to observe a small summary of the data in the graph:
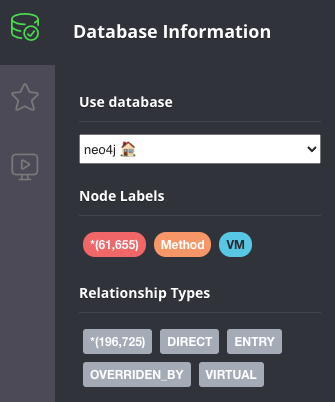
The data above shows that there are ~60000 methods, and just over ~200000 edges between them. The Quarkus application demonstrated here is very basic, so there’s not a lot we can explore, but here are some example queries you can run to explore the graph in more detail. Typically, you’d start by looking for a given method:
match (m:Method) where m.name = "hello" return *From there, you can narrow down to a given method on a specific type:
match (m:Method) where m.name = "hello" and m.type =~ ".*GreetingResource" return *Once you’ve located the node for the specific method you’re after, a typical question you’d want to get an answer for is: why does this method get included in the call tree? To do that, start from the method and look for incoming connections at a given depth, starting from the end method. For example, methods that directly call a method can be located via:
match (m:Method) <- [*1..1] - (o) where m.name = "hello" return *Then you can look for direct calls at depth of 2, so you’d search for methods that call methods that call into the target method:
match (m:Method) <- [*1..2] - (o) where m.name = "hello" return *You can continue going up layers, but unfortunately if you reach a depth with too many nodes, the Neo4j browser will be unable to visualize them all. When that happens, you can alternatively run the queries directly against the cypher shell:
docker exec testneo4j bin/cypher-shell -u neo4j -p ${NEO_PASS} \
  "match (m:Method) <- [*1..10] - (o) where m.name = 'hello' return *"
For further information, check out this blog post that explores the Quarkus Hibernate ORM quickstart using the techniques explained above.
Used Packages/Classes/Methods Reports
used_packages, used_classes and used_methods text file reports come in handy when comparing different versions of the application,
e.g. why does the image take longer to build? Or why is the image bigger now?
Further Reports
Mandrel can produce further reports beyond the ones that are enabled with the -Dquarkus.native.enable-reports option.
These are called expert options and you can learn more about them by running:
docker run quay.io/quarkus/ubi-quarkus-mandrel:22.0-java11 --expert-options-allTo use these expert options, add them comma separated to the -Dquarkus.native.additional-build-args parameter.
Build-time vs Run-time Initialization
Quarkus instructs Mandrel to initialize as much as possible at build time, so that runtime startup can be as fast as possible. This is important in containerized environments where the startup speed has a big impact on how quickly an application is ready to do work. Build time initialization also minimizes the risk of runtime failures due to unsupported features becoming reachable through runtime initialization, thus making Quarkus more reliable.
The most common examples of build-time initialized code are static variables and blocks. Although Mandrel executes those at run-time by default, Quarkus instructs Mandrel to run them at build-time for the reasons given.
This means that any static variables initialized inline, or initialized in a static block, will keep the same value even if the application is restarted. This is a different behaviour compared to what would happen if executed as Java.
To see this in action with a very basic example,
add a new TimestampResource to the application that looks like this:
package org.acme;

import javax.ws.rs.GET;
import javax.ws.rs.Path;
import javax.ws.rs.Produces;
import javax.ws.rs.core.MediaType;

@Path("/timestamp")
public class TimestampResource {

    static long firstAccess = System.currentTimeMillis();

    @GET
    @Produces(MediaType.TEXT_PLAIN)
    public String timestamp() {
        return "First access " + firstAccess;
    }
}
Rebuild the binary using:
./mvnw package -DskipTests -PnativeRun the application in one terminal (make sure you stop any other native executable container runs before executing this):
docker run -i --rm -p 8080:8080 test/debugging-native:1.0.0-SNAPSHOTSend a GET request multiple times from another terminal:
curl -w '\n' http://localhost:8080/timestamp # run this multiple timesto see how the current time has been baked into the binary. This time was calculated when the binary was being built, hence application restarts have no effect.
In some situations, built time initializations can lead to errors when building native executables. One example is when a value gets computed at build time which is forbidden to reside in the heap of the JVM that gets baked into the binary. To see this in action, add this REST resource:
package org.acme;

import org.jboss.resteasy.annotations.jaxrs.PathParam;

import javax.crypto.Cipher;
import javax.crypto.NoSuchPaddingException;
import javax.ws.rs.GET;
import javax.ws.rs.Path;
import java.nio.charset.StandardCharsets;
import java.security.KeyPair;
import java.security.KeyPairGenerator;
import java.security.NoSuchAlgorithmException;

@Path("/encrypt-decrypt")
public class EncryptDecryptResource {

    static final KeyPairGenerator KEY_PAIR_GEN;
    static final Cipher CIPHER;

    static {
        try {
            KEY_PAIR_GEN = KeyPairGenerator.getInstance("RSA");
            KEY_PAIR_GEN.initialize(1024);

            CIPHER = Cipher.getInstance("RSA");
        } catch (NoSuchAlgorithmException | NoSuchPaddingException e) {
            throw new RuntimeException(e);
        }
    }

    @GET
    @Path("/{message}")
    public String encryptDecrypt(@PathParam String message) throws Exception {
        KeyPair keyPair = KEY_PAIR_GEN.generateKeyPair();

        byte[] text = message.getBytes(StandardCharsets.UTF_8);

        // Encrypt with private key
        CIPHER.init(Cipher.ENCRYPT_MODE, keyPair.getPrivate());
        byte[] encrypted = CIPHER.doFinal(text);

        // Decrypt with public key
        CIPHER.init(Cipher.DECRYPT_MODE, keyPair.getPublic());
        byte[] unencrypted = CIPHER.doFinal(encrypted);

        return new String(unencrypted, StandardCharsets.UTF_8);
    }
}
When trying to rebuild the application, you’ll encounter an error:
./mvnw package -DskipTests -Pnative
...
Error: Unsupported features in 2 methods
Detailed message:
Error: Detected an instance of Random/SplittableRandom class in the image heap. Instances created during image generation have cached seed values and don't behave as expected.  To see how this object got instantiated use --trace-object-instantiation=java.security.SecureRandom. The object was probably created by a class initializer and is reachable from a static field. You can request class initialization at image runtime by using the option --initialize-at-run-time=<class-name>. Or you can write your own initialization methods and call them explicitly from your main entry point.
Trace: Object was reached by
	reading field java.security.KeyPairGenerator$Delegate.initRandom of
		constant java.security.KeyPairGenerator$Delegate@58b0fe1b reached by
	reading field org.acme.EncryptDecryptResource.KEY_PAIR_GEN
Error: Detected an instance of Random/SplittableRandom class in the image heap. Instances created during image generation have cached seed values and don't behave as expected.  To see how this object got instantiated use --trace-object-instantiation=java.security.SecureRandom. The object was probably created by a class initializer and is reachable from a static field. You can request class initialization at image runtime by using the option --initialize-at-run-time=<class-name>. Or you can write your own initialization methods and call them explicitly from your main entry point.
Trace: Object was reached by
	reading field sun.security.rsa.RSAKeyPairGenerator.random of
		constant sun.security.rsa.RSAKeyPairGenerator$Legacy@3248a092 reached by
	reading field java.security.KeyPairGenerator$Delegate.spi of
		constant java.security.KeyPairGenerator$Delegate@58b0fe1b reached by
	reading field org.acme.EncryptDecryptResource.KEY_PAIR_GEN
So, what the message above is telling us is that our application caches a value that is supposed to be random as a constant. This is not desirable because something that’s supposed to be random is no longer so, because the seed is baked in the image. The message above makes it quite clear what is causing this, but in other situations the cause might be more obfuscated. As a next step, we’ll add some extra flags to the native executable generation to get more information.
As suggested by the message, let’s start by adding an option to track object instantiation:
./mvnw package -DskipTests -Pnative \
    -Dquarkus.native.additional-build-args="--trace-object-instantiation=java.security.SecureRandom"
...
Error: Unsupported features in 2 methods
Detailed message:
Error: Detected an instance of Random/SplittableRandom class in the image heap. Instances created during image generation have cached seed values and don't behave as expected.  Object has been initialized by the com.sun.jndi.dns.DnsClient class initializer with a trace:
 	at java.security.SecureRandom.<init>(SecureRandom.java:218)
	at sun.security.jca.JCAUtil$CachedSecureRandomHolder.<clinit>(JCAUtil.java:59)
	at sun.security.jca.JCAUtil.getSecureRandom(JCAUtil.java:69)
	at com.sun.jndi.dns.DnsClient.<clinit>(DnsClient.java:82)
. Try avoiding to initialize the class that caused initialization of the object. The object was probably created by a class initializer and is reachable from a static field. You can request class initialization at image runtime by using the option --initialize-at-run-time=<class-name>. Or you can write your own initialization methods and call them explicitly from your main entry point.
Trace: Object was reached by
	reading field java.security.KeyPairGenerator$Delegate.initRandom of
		constant java.security.KeyPairGenerator$Delegate@4a5058f9 reached by
	reading field org.acme.EncryptDecryptResource.KEY_PAIR_GEN
Error: Detected an instance of Random/SplittableRandom class in the image heap. Instances created during image generation have cached seed values and don't behave as expected.  Object has been initialized by the com.sun.jndi.dns.DnsClient class initializer with a trace:
 	at java.security.SecureRandom.<init>(SecureRandom.java:218)
	at sun.security.jca.JCAUtil$CachedSecureRandomHolder.<clinit>(JCAUtil.java:59)
	at sun.security.jca.JCAUtil.getSecureRandom(JCAUtil.java:69)
	at com.sun.jndi.dns.DnsClient.<clinit>(DnsClient.java:82)
. Try avoiding to initialize the class that caused initialization of the object. The object was probably created by a class initializer and is reachable from a static field. You can request class initialization at image runtime by using the option --initialize-at-run-time=<class-name>. Or you can write your own initialization methods and call them explicitly from your main entry point.
Trace: Object was reached by
	reading field sun.security.rsa.RSAKeyPairGenerator.random of
		constant sun.security.rsa.RSAKeyPairGenerator$Legacy@71880cf1 reached by
	reading field java.security.KeyPairGenerator$Delegate.spi of
		constant java.security.KeyPairGenerator$Delegate@4a5058f9 reached by
	reading field org.acme.EncryptDecryptResource.KEY_PAIR_GEN
The error messages point to the code in the example,
but it can be suprising that a reference to DnsClient appears.
Why is that?
The key is in what happens inside KeyPairGenerator.initialize() method call.
It uses JCAUtil.getSecureRandom() which is why this is problematic,
but sometimes the tracing options can show some stack traces that do not represent what happens in reality.
The best option is to dig through the source code and use tracing output for guidance but not as full truth.
Moving the KEY_PAIR_GEN.initialize(1024); call to the run-time executed method encryptDecrypt is enough to solve this particular issue.
Additional information on which classes are initialized and why can be obtained by passing in the -H:+PrintClassInitialization flag via -Dquarkus.native.additional-build-args.
Profile Runtime Behaviour
Single Thread
In this exercise, we profile the runtime behaviour of some Quarkus application that was compiled to a native executable to determine where the bottleneck is. Assume that you’re in a scenario where profiling the pure Java version is not possible, maybe because the issue only occurs with the native version of the application.
Add a REST resource with the following code (example courtesy of Andrei Pangin’s Java Profiling presentation):
package org.acme;

import javax.ws.rs.GET;
import javax.ws.rs.Path;
import javax.ws.rs.Produces;
import javax.ws.rs.core.MediaType;

@Path("/string-builder")
public class StringBuilderResource {

    @GET
    @Produces(MediaType.TEXT_PLAIN)
    public String appendDelete() {
        StringBuilder sb = new StringBuilder();
        sb.append(new char[1_000_000]);

        do
        {
            sb.append(12345);
            sb.delete(0, 5);
        } while (Thread.currentThread().isAlive());

        return "Never happens";
    }
}
Recompile the application, rebuild the binary and run it. Attempting a simple curl will never complete, as expected:
$ ./mvnw package -DskipTests -Pnative
...
$ docker run -i --rm -p 8080:8080 test/debugging-native:1.0.0-SNAPSHOT
...
$ curl http://localhost:8080/string-builder # this will never complete
However, the question we’re trying to answer here is: what would be the bottleneck of such code? Is it appending the characters? Is it deleting it? Is it checking whether the thread is alive?
Since we’re dealing with a linux native executable,
we can use tools like perf directly.
To use perf,
go to the root of the project and start the tools container created earlier as a privileged user:
docker run --privileged -t -i --rm -v ${PWD}:/data -p 8080:8080 fedora-tools:v1|
Note that in order to use |
Once the container is running, you need to ensure that the kernel is ready for the profiling exercises:
echo -1 | sudo tee /proc/sys/kernel/perf_event_paranoid
echo 0 | sudo tee /proc/sys/kernel/kptr_restrict|
The kernel modifications above also apply to Linux virtual machines.
If running on a bare metal Linux machine,
tweaking only |
Then, from inside the tools container we execute:
perf record -F 1009 -g -a ./target/debugging-native-1.0.0-SNAPSHOT-runnerWhile perf record is running, open another window and access the endpoint:
curl http://localhost:8080/string-builder # this will never completeAfter a few seconds, halt the perf record process.
This will generate a perf.data file.
We could use perf report to inspect the perf data,
but you can often get a better picture showing that data as a flame graph.
To generate flame graphs, we will use
FlameGraph GitHub repository,
which has already been installed inside the tools container.
Next, generate a flame graph using the data captured via perf record:
$ perf script -i perf.data | ${FG_HOME}/stackcollapse-perf.pl > out.perf-folded
$ ${FG_HOME}/flamegraph.pl out.perf-folded > flamegraph.svg
The flame graph is an svg file that a web browser, such as Firefox, can easily display.
After the above two commands complete one can open flamegraph.svg in their browser:

We see a big majority of time spent in what is supposed to be our main,
but we see no trace of the StringBuilderResource class,
nor the StringBuilder class we’re calling.
We should look at the symbol table of the binary:
can we find symbols for our class and StringBuilder?
We need those in order to get meaningful data.
From within the tools container, query the symbol table:
objdump -t ./target/debugging-native-1.0.0-SNAPSHOT-runner | grep StringBuilder
[no output]
No output appears when querying the symbol table. This is why we don’t see any call graphs in the flame graphs. This is a deliberate decision that native-image makes. By default, it removes symbols from the binary.
To regain the symbols, we need to rebuild the binary instructing GraalVM not to delete the symbols. On top of that, enable DWARF debug info so that the stack traces can be populated with that information. From outside the tools container, execute:
./mvnw package -DskipTests -Pnative \
    -Dquarkus.native.debug.enabled \
    -Dquarkus.native.additional-build-args=-H:-DeleteLocalSymbols
Next, re-enter the tools container if you exited,
and inspect the native executable with objdump,
and see how the symbols are now present:
$ objdump -t ./target/debugging-native-1.0.0-SNAPSHOT-runner | grep StringBuilder
000000000050a940 l     F .text	0000000000000091              .hidden ReflectionAccessorHolder_StringBuilderResource_appendDelete_9e06d4817d0208a0cce97ebcc0952534cac45a19_e22addf7d3eaa3ad14013ce01941dc25beba7621
000000000050a9e0 l     F .text	00000000000000bb              .hidden ReflectionAccessorHolder_StringBuilderResource_constructor_0f8140ea801718b80c05b979a515d8a67b8f3208_12baae06bcd6a1ef9432189004ae4e4e176dd5a4
...
You should see a long list of symbols that match that pattern.
Then, run the executable through perf, indicating that the call graph is dwarf:
perf record -F 1009 --call-graph dwarf -a ./target/debugging-native-1.0.0-SNAPSHOT-runnerRun the curl command once again, stop the binary, generate the flamegraphs and open it:
perf script -i perf.data | ${FG_HOME}/stackcollapse-perf.pl > out.perf-folded
${FG_HOME}/flamegraph.pl out.perf-folded > flamegraph.svg
The flamegraph now shows where the bottleneck is.
It’s when StringBuilder.delete() is called which calls System.arraycopy().
The issue is that 1 million characters need to be shifted in very small increments:

Multi-Thread
Multi-threaded programs might require special attention when trying to understand their runtime behaviour.
To demonstrate this, add this MulticastResource code to your project
(example courtesy of Andrei Pangin’s Java Profiling presentation):
package org.acme;

import javax.ws.rs.GET;
import javax.ws.rs.Path;
import javax.ws.rs.Produces;
import javax.ws.rs.core.MediaType;
import java.net.InetSocketAddress;
import java.nio.ByteBuffer;
import java.nio.channels.DatagramChannel;
import java.util.concurrent.ExecutorService;
import java.util.concurrent.Executors;
import java.util.concurrent.ThreadFactory;
import java.util.concurrent.atomic.AtomicInteger;

@Path("/multicast")
public class MulticastResource
{
    @GET
    @Produces(MediaType.TEXT_PLAIN)
    public String send() throws Exception {
        sendMulticasts();
        return "Multicast packets sent";
    }

    static void sendMulticasts() throws Exception {
        DatagramChannel ch = DatagramChannel.open();
        ch.bind(new InetSocketAddress(5555));
        ch.configureBlocking(false);

        ExecutorService pool =
            Executors.newCachedThreadPool(new ShortNameThreadFactory());
        for (int i = 0; i < 10; i++) {
            pool.submit(() -> {
                final ByteBuffer buf = ByteBuffer.allocateDirect(1000);
                final InetSocketAddress remoteAddr =
                    new InetSocketAddress("127.0.0.1", 5556);

                while (true) {
                    buf.clear();
                    ch.send(buf, remoteAddr);
                }
            });
        }

        System.out.println("Warming up...");
        Thread.sleep(3000);

        System.out.println("Benchmarking...");
        Thread.sleep(5000);
    }

    private static final class ShortNameThreadFactory implements ThreadFactory {

        private final AtomicInteger threadNumber = new AtomicInteger(1);
        private final String namePrefix = "thread-";

        public Thread newThread(Runnable r) {
            return new Thread(r, namePrefix + threadNumber.getAndIncrement());
        }
    }
}
Build the native executable with debug info:
./mvnw package -DskipTests -Pnative \
    -Dquarkus.native.debug.enabled \
    -Dquarkus.native.additional-build-args=-H:-DeleteLocalSymbols
From inside the tools container (as privileged user) run the native executable through perf:
perf record -F 1009 --call-graph dwarf -a ./target/debugging-native-1.0.0-SNAPSHOT-runnerInvoke the endpoint to send the multicast packets:
curl -w '\n' http://localhost:8080/multicastMake and open a flamegraph:
perf script -i perf.data | ${FG_HOME}/stackcollapse-perf.pl > out.perf-folded
${FG_HOME}/flamegraph.pl out.perf-folded > flamegraph.svg
The flamegraph produced looks odd. Each thread is treated independently even though they all do the same work. This makes it difficult to have a clear picture of the bottlenecks in the program.
This is happening because from a perf perspective, each thread is a different command.
We can see that if we inspect perf report:
perf report --stdio
# Children      Self  Command          Shared Object       Symbol
# ........  ........  ...............  ......................................  ......................................................................................
...
     6.95%     0.03%  thread-2         debugging-native-1.0.0-SNAPSHOT-runner  [.] MulticastResource_lambda$sendMulticasts$0_cb1f7b5dcaed7dd4e3f90d18bad517d67eae4d88
...
     4.60%     0.02%  thread-10        debugging-native-1.0.0-SNAPSHOT-runner  [.] MulticastResource_lambda$sendMulticasts$0_cb1f7b5dcaed7dd4e3f90d18bad517d67eae4d88
...
This can be worked around by applying some modifications to the perf output, in order to make all threads have the same name. E.g.
perf script | sed -E "s/thread-[0-9]*/thread/" | ${FG_HOME}/stackcollapse-perf.pl > out.perf-folded
${FG_HOME}/flamegraph.pl out.perf-folded > flamegraph.svg
When you open the flamegraph, you will see all threads' work collapsed into a single area. Then, you can clearly see that there’s some locking that could affect performance.
Debugging Native Crashes
One of the drawbacks of using native executables is that they cannot be debugged using the standard Java debuggers,
instead we need to debug them using gdb, the GNU Project debugger.
To demonstrate how to do this,
we are going to generate a native Quarkus application that crashes due to a Segmentation Fault when accessing http://localhost:8080/crash.
To achieve this, add the following REST resource to the project:
package org.acme;

import sun.misc.Unsafe;

import javax.ws.rs.GET;
import javax.ws.rs.Path;
import javax.ws.rs.Produces;
import javax.ws.rs.core.MediaType;
import java.lang.reflect.Field;

@Path("/crash")
public class CrashResource {

    @GET
    @Produces(MediaType.TEXT_PLAIN)
    public String hello() {
        Field theUnsafe = null;
        try {
            theUnsafe = Unsafe.class.getDeclaredField("theUnsafe");
            theUnsafe.setAccessible(true);
            Unsafe unsafe = (Unsafe) theUnsafe.get(null);
            unsafe.copyMemory(0, 128, 256);
        } catch (NoSuchFieldException | IllegalAccessException e) {
            e.printStackTrace();
        }
        return "Never happens";
    }
}
This code will try to copy 256 bytes from address 0x0 to 0x80 resulting in a Segmentation Fault.
To verify this compile and run the example application:
$ ./mvnw package -DskipTests -Pnative
...
$ docker run -i --rm -p 8080:8080 test/debugging-native:1.0.0-SNAPSHOT
...
$ curl http://localhost:8080/crash
This will result in the following output:
$ docker run -i --rm -p 8080:8080 test/debugging-native:1.0.0-SNAPSHOT
...
Segfault detected, aborting process. Use runtime option -R:-InstallSegfaultHandler if you don't want to use SubstrateSegfaultHandler.
...
The omitted output above contains clues to what caused the issue,
but in this exercise we are going to assume that no information was provided.
Let’s try to debug the segmentation fault using gdb.
To do that, go to the root of the project and enter the tools container:
docker run -t -i --rm -v ${PWD}:/data -p 8080:8080 fedora-tools:v1 /bin/bashThen start the application in gdb and execute run.
gdb ./target/debugging-native-1.0.0-SNAPSHOT-runner
...
Reading symbols from ./target/debugging-native-1.0.0-SNAPSHOT-runner...
(No debugging symbols found in ./target/debugging-ntaive-1.0.0-SNAPSHOT-runner)
(gdb) run
Starting program: /data/target/debugging-native-1.0.0-SNAPSHOT-runner
Next, try to access http://localhost:8080/crash:
curl http://localhost:8080/crashThis will result in the following message in gdb:
Thread 4 "ecutor-thread-0" received signal SIGSEGV, Segmentation fault.
[Switching to Thread 0x7fe103dff640 (LWP 190)]
0x0000000000461f6e in ?? ()
If we try to get more info about the backtrace that led to this crash we will see that there is not enough information available.
(gdb) bt
#0  0x0000000000418b5e in ?? ()
#1  0x00007ffff6f2d328 in ?? ()
#2  0x0000000000418a04 in ?? ()
#3  0x00007ffff44062a0 in ?? ()
#4  0x00000000010c3dd3 in ?? ()
#5  0x0000000000000100 in ?? ()
#6  0x0000000000000000 in ?? ()
This is because we didn’t compile the Quarkus application with -Dquarkus.native.debug.enabled,
so gdb cannot find debugging symbols for our native executable,
as indicated by the "No debugging symbols found in ./target/debugging-native-1.0.0-SNAPSHOT-runner" message in the beginning of gdb.
Recompiling the Quarkus application with -Dquarkus.native.debug.enabled and rerunning it through gdb we are now able to get a backtrace making clear what caused the crash.
On top of that, add -H:-OmitInlinedMethodDebugLineInfo option to avoid inlined methods being omitted from the backtrace:
./mvnw package -DskipTests -Pnative \
    -Dquarkus.native.debug.enabled \
    -Dquarkus.native.additional-build-args=-H:-OmitInlinedMethodDebugLineInfo
...
$ gdb ./target/debugging-native-1.0.0-SNAPSHOT-runner
Reading symbols from ./target/debugging-native-1.0.0-SNAPSHOT-runner...
(gdb) run
Starting program: /data/target/debugging-native-1.0.0-SNAPSHOT-runner
...
$ curl http://localhost:8080/crash
This will result in the following message in gdb:
Thread 4 "ecutor-thread-0" received signal SIGSEGV, Segmentation fault.
[Switching to Thread 0x7fffeffff640 (LWP 362984)]
com.oracle.svm.core.UnmanagedMemoryUtil::copyLongsBackward(org.graalvm.word.Pointer *, org.graalvm.word.Pointer *, org.graalvm.word.UnsignedWord *) ()
	at com/oracle/svm/core/UnmanagedMemoryUtil.java:169
169    com/oracle/svm/core/UnmanagedMemoryUtil.java: No such file or directory.
We already see that gdb is able to tell us which method caused the crash and where it’s located in the source code.
We can also get a backtrace of the call graph that led us to this state:
(gdb) bt
#0  com.oracle.svm.core.UnmanagedMemoryUtil::copyLongsBackward(org.graalvm.word.Pointer *, org.graalvm.word.Pointer *, org.graalvm.word.UnsignedWord *) () at com/oracle/svm/core/UnmanagedMemoryUtil.java:169
#1  0x0000000000461e14 in com.oracle.svm.core.UnmanagedMemoryUtil::copyBackward(org.graalvm.word.Pointer *, org.graalvm.word.Pointer *, org.graalvm.word.UnsignedWord *) () at com/oracle/svm/core/UnmanagedMemoryUtil.java:110
#2  0x0000000000461dc8 in com.oracle.svm.core.UnmanagedMemoryUtil::copy(org.graalvm.word.Pointer *, org.graalvm.word.Pointer *, org.graalvm.word.UnsignedWord *) () at com/oracle/svm/core/UnmanagedMemoryUtil.java:67
#3  0x000000000045d3c0 in com.oracle.svm.core.JavaMemoryUtil::unsafeCopyMemory(java.lang.Object *, long, java.lang.Object *, long, long) () at com/oracle/svm/core/JavaMemoryUtil.java:276
#4  0x00000000013277de in jdk.internal.misc.Unsafe::copyMemory0 () at com/oracle/svm/core/jdk/SunMiscSubstitutions.java:125
#5  jdk.internal.misc.Unsafe::copyMemory(java.lang.Object *, long, java.lang.Object *, long, long) () at jdk/internal/misc/Unsafe.java:788
#6  0x00000000013b1a3f in jdk.internal.misc.Unsafe::copyMemory () at jdk/internal/misc/Unsafe.java:799
#7  sun.misc.Unsafe::copyMemory () at sun/misc/Unsafe.java:585
#8  org.acme.CrashResource::hello(void) () at org/acme/CrashResource.java:22
Similarly, we can get a backtrace of the call graph of other threads.
-
First, we can list the available threads with:
(gdb) info threads Id Target Id Frame 1 Thread 0x7fcc62a07d00 (LWP 322) "debugging-nativ" 0x00007fcc62b8b77a in __futex_abstimed_wait_common () from /lib64/libc.so.6 2 Thread 0x7fcc60eff640 (LWP 326) "gnal Dispatcher" 0x00007fcc62b8b77a in __futex_abstimed_wait_common () from /lib64/libc.so.6 * 4 Thread 0x7fcc5b7fe640 (LWP 328) "ecutor-thread-0" com.oracle.svm.core.UnmanagedMemoryUtil::copyLongsBackward(org.graalvm.word.Pointer *, org.graalvm.word.Pointer *, org.graalvm.word.UnsignedWord *) () at com/oracle/svm/core/UnmanagedMemoryUtil.java:169 5 Thread 0x7fcc5abff640 (LWP 329) "-thread-checker" 0x00007fcc62b8b77a in __futex_abstimed_wait_common () from /lib64/libc.so.6 6 Thread 0x7fcc59dff640 (LWP 330) "ntloop-thread-0" 0x00007fcc62c12c9e in epoll_wait () from /lib64/libc.so.6 ... -
select the thread we want to inspect, e.g. thread 1:
(gdb) thread 1 [Switching to thread 1 (Thread 0x7ffff7a58d00 (LWP 1028851))] #0 __futex_abstimed_wait_common64 (private=0, cancel=true, abstime=0x0, op=393, expected=0, futex_word=0x2cd7adc) at futex-internal.c:57 57 return INTERNAL_SYSCALL_CANCEL (futex_time64, futex_word, op, expected, -
and, finally, print the stack trace:
(gdb) bt
#0  __futex_abstimed_wait_common64 (private=0, cancel=true, abstime=0x0, op=393, expected=0, futex_word=0x2cd7adc) at futex-internal.c:57
#1  __futex_abstimed_wait_common (futex_word=futex_word@entry=0x2cd7adc, expected=expected@entry=0, clockid=clockid@entry=0, abstime=abstime@entry=0x0, private=private@entry=0,
    cancel=cancel@entry=true) at futex-internal.c:87
#2  0x00007ffff7bdd79f in __GI___futex_abstimed_wait_cancelable64 (futex_word=futex_word@entry=0x2cd7adc, expected=expected@entry=0, clockid=clockid@entry=0, abstime=abstime@entry=0x0,
    private=private@entry=0) at futex-internal.c:139
#3  0x00007ffff7bdfeb0 in __pthread_cond_wait_common (abstime=0x0, clockid=0, mutex=0x2ca07b0, cond=0x2cd7ab0) at pthread_cond_wait.c:504
#4  ___pthread_cond_wait (cond=0x2cd7ab0, mutex=0x2ca07b0) at pthread_cond_wait.c:619
#5  0x00000000004e2014 in com.oracle.svm.core.posix.headers.Pthread::pthread_cond_wait () at com/oracle/svm/core/posix/thread/PosixJavaThreads.java:252
#6  com.oracle.svm.core.posix.thread.PosixParkEvent::condWait(void) () at com/oracle/svm/core/posix/thread/PosixJavaThreads.java:252
#7  0x0000000000547070 in com.oracle.svm.core.thread.JavaThreads::park(void) () at com/oracle/svm/core/thread/JavaThreads.java:764
#8  0x0000000000fc5f44 in jdk.internal.misc.Unsafe::park(boolean, long) () at com/oracle/svm/core/thread/Target_jdk_internal_misc_Unsafe_JavaThreads.java:49
#9  0x0000000000eac1ad in java.util.concurrent.locks.LockSupport::park(java.lang.Object *) () at java/util/concurrent/locks/LockSupport.java:194
#10 0x0000000000ea5d68 in java.util.concurrent.locks.AbstractQueuedSynchronizer$ConditionObject::awaitUninterruptibly(void) ()
    at java/util/concurrent/locks/AbstractQueuedSynchronizer.java:2018
#11 0x00000000008b6b30 in io.quarkus.runtime.ApplicationLifecycleManager::run(io.quarkus.runtime.Application *, java.lang.Class *, java.util.function.BiConsumer *, java.lang.String[] *) ()
    at io/quarkus/runtime/ApplicationLifecycleManager.java:144
#12 0x00000000008bc055 in io.quarkus.runtime.Quarkus::run(java.lang.Class *, java.util.function.BiConsumer *, java.lang.String[] *) () at io/quarkus/runtime/Quarkus.java:67
#13 0x000000000045c88b in io.quarkus.runtime.Quarkus::run () at io/quarkus/runtime/Quarkus.java:41
#14 io.quarkus.runtime.Quarkus::run () at io/quarkus/runtime/Quarkus.java:120
#15 0x000000000045c88b in io.quarkus.runner.GeneratedMain::main ()
#16 com.oracle.svm.core.JavaMainWrapper::runCore () at com/oracle/svm/core/JavaMainWrapper.java:150
#17 com.oracle.svm.core.JavaMainWrapper::run(int, org.graalvm.nativeimage.c.type.CCharPointerPointer *) () at com/oracle/svm/core/JavaMainWrapper.java:186
#18 0x000000000048084d in com.oracle.svm.core.code.IsolateEnterStub::JavaMainWrapper_run_5087f5482cc9a6abc971913ece43acb471d2631b(int, org.graalvm.nativeimage.c.type.CCharPointerPointer *)
    () at com/oracle/svm/core/JavaMainWrapper.java:280
Alternatively, we can list the backtraces of all threads with a single command:
(gdb) thread apply all backtrace

Thread 22 (Thread 0x7fffc8dff640 (LWP 1028872) "tloop-thread-15"):
#0  0x00007ffff7c64c2e in epoll_wait (epfd=8, events=0x2ca3880, maxevents=1024, timeout=-1) at ../sysdeps/unix/sysv/linux/epoll_wait.c:30
#1  0x000000000166e01c in Java_sun_nio_ch_EPoll_wait ()
#2  0x00000000011bfece in sun.nio.ch.EPoll::wait(int, long, int, int) () at com/oracle/svm/core/stack/JavaFrameAnchors.java:42
#3  0x00000000011c08d2 in sun.nio.ch.EPollSelectorImpl::doSelect(java.util.function.Consumer *, long) () at sun/nio/ch/EPollSelectorImpl.java:120
#4  0x00000000011d8977 in sun.nio.ch.SelectorImpl::lockAndDoSelect(java.util.function.Consumer *, long) () at sun/nio/ch/SelectorImpl.java:124
#5  0x0000000000705720 in sun.nio.ch.SelectorImpl::select () at sun/nio/ch/SelectorImpl.java:141
#6  io.netty.channel.nio.SelectedSelectionKeySetSelector::select(void) () at io/netty/channel/nio/SelectedSelectionKeySetSelector.java:68
#7  0x0000000000703c2e in io.netty.channel.nio.NioEventLoop::select(long) () at io/netty/channel/nio/NioEventLoop.java:813
#8  0x0000000000701a5f in io.netty.channel.nio.NioEventLoop::run(void) () at io/netty/channel/nio/NioEventLoop.java:460
#9  0x00000000008496df in io.netty.util.concurrent.SingleThreadEventExecutor$4::run(void) () at io/netty/util/concurrent/SingleThreadEventExecutor.java:986
#10 0x0000000000860762 in io.netty.util.internal.ThreadExecutorMap$2::run(void) () at io/netty/util/internal/ThreadExecutorMap.java:74
#11 0x0000000000840da4 in io.netty.util.concurrent.FastThreadLocalRunnable::run(void) () at io/netty/util/concurrent/FastThreadLocalRunnable.java:30
#12 0x0000000000b7dd04 in java.lang.Thread::run(void) () at java/lang/Thread.java:829
#13 0x0000000000547dcc in com.oracle.svm.core.thread.JavaThreads::threadStartRoutine(org.graalvm.nativeimage.ObjectHandle *) () at com/oracle/svm/core/thread/JavaThreads.java:597
#14 0x00000000004e15b1 in com.oracle.svm.core.posix.thread.PosixJavaThreads::pthreadStartRoutine(com.oracle.svm.core.thread.JavaThreads$ThreadStartData *) () at com/oracle/svm/core/posix/thread/PosixJavaThreads.java:194
#15 0x0000000000480984 in com.oracle.svm.core.code.IsolateEnterStub::PosixJavaThreads_pthreadStartRoutine_e1f4a8c0039f8337338252cd8734f63a79b5e3df(com.oracle.svm.core.thread.JavaThreads$ThreadStartData *) () at com/oracle/svm/core/posix/thread/PosixJavaThreads.java:182
#16 0x00007ffff7be0b1a in start_thread (arg=<optimized out>) at pthread_create.c:443
#17 0x00007ffff7c65650 in clone3 () at ../sysdeps/unix/sysv/linux/x86_64/clone3.S:81

Thread 21 (Thread 0x7fffc97fa640 (LWP 1028871) "tloop-thread-14"):
#0  0x00007ffff7c64c2e in epoll_wait (epfd=53, events=0x2cd0970, maxevents=1024, timeout=-1) at ../sysdeps/unix/sysv/linux/epoll_wait.c:30
#1  0x000000000166e01c in Java_sun_nio_ch_EPoll_wait ()
#2  0x00000000011bfece in sun.nio.ch.EPoll::wait(int, long, int, int) () at com/oracle/svm/core/stack/JavaFrameAnchors.java:42
#3  0x00000000011c08d2 in sun.nio.ch.EPollSelectorImpl::doSelect(java.util.function.Consumer *, long) () at sun/nio/ch/EPollSelectorImpl.java:120
#4  0x00000000011d8977 in sun.nio.ch.SelectorImpl::lockAndDoSelect(java.util.function.Consumer *, long) () at sun/nio/ch/SelectorImpl.java:124
#5  0x0000000000705720 in sun.nio.ch.SelectorImpl::select () at sun/nio/ch/SelectorImpl.java:141
#6  io.netty.channel.nio.SelectedSelectionKeySetSelector::select(void) () at io/netty/channel/nio/SelectedSelectionKeySetSelector.java:68
#7  0x0000000000703c2e in io.netty.channel.nio.NioEventLoop::select(long) () at io/netty/channel/nio/NioEventLoop.java:813
#8  0x0000000000701a5f in io.netty.channel.nio.NioEventLoop::run(void) () at io/netty/channel/nio/NioEventLoop.java:460
#9  0x00000000008496df in io.netty.util.concurrent.SingleThreadEventExecutor$4::run(void) () at io/netty/util/concurrent/SingleThreadEventExecutor.java:986
#10 0x0000000000860762 in io.netty.util.internal.ThreadExecutorMap$2::run(void) () at io/netty/util/internal/ThreadExecutorMap.java:74
#11 0x0000000000840da4 in io.netty.util.concurrent.FastThreadLocalRunnable::run(void) () at io/netty/util/concurrent/FastThreadLocalRunnable.java:30
#12 0x0000000000b7dd04 in java.lang.Thread::run(void) () at java/lang/Thread.java:829
#13 0x0000000000547dcc in com.oracle.svm.core.thread.JavaThreads::threadStartRoutine(org.graalvm.nativeimage.ObjectHandle *) () at com/oracle/svm/core/thread/JavaThreads.java:597
#14 0x00000000004e15b1 in com.oracle.svm.core.posix.thread.PosixJavaThreads::pthreadStartRoutine(com.oracle.svm.core.thread.JavaThreads$ThreadStartData *) () at com/oracle/svm/core/posix/thread/PosixJavaThreads.java:194
#15 0x0000000000480984 in com.oracle.svm.core.code.IsolateEnterStub::PosixJavaThreads_pthreadStartRoutine_e1f4a8c0039f8337338252cd8734f63a79b5e3df(com.oracle.svm.core.thread.JavaThreads$ThreadStartData *) () at com/oracle/svm/core/posix/thread/PosixJavaThreads.java:182
#16 0x00007ffff7be0b1a in start_thread (arg=<optimized out>) at pthread_create.c:443
#17 0x00007ffff7c65650 in clone3 () at ../sysdeps/unix/sysv/linux/x86_64/clone3.S:81

Thread 20 (Thread 0x7fffc9ffb640 (LWP 1028870) "tloop-thread-13"):
...
Note, however, that despite being able to get a backtrace we can still not list the source code at point with the list command.
(gdb) list
164    in com/oracle/svm/core/UnmanagedMemoryUtil.java
This is because gdb is not aware of the location of the source files.
We are running the executable outside of the target directory.
To fix this we can either rerun gdb from the target directory or,
run directory target/debugging-native-1.0.0-SNAPSHOT-native-image-source-jar/sources e.g.:
(gdb) directory target/debugging-native-1.0.0-SNAPSHOT-native-image-source-jar/sources
Source directories searched: /data/target/debugging-native-1.0.0-SNAPSHOT-native-image-source-jar/sources:$cdir:$cwd
(gdb) list
164        	UnsignedWord offset = size;
165        	while (offset.aboveOrEqual(32)) {
166            	offset = offset.subtract(32);
167            	Pointer src = from.add(offset);
168            	Pointer dst = to.add(offset);
169            	long l24 = src.readLong(24);
170            	long l16 = src.readLong(16);
171            	long l8 = src.readLong(8);
172            	long l0 = src.readLong(0);
173            	dst.writeLong(24, l24);
We can now examine line 169 and get a first hint of what might be wrong
(in this case we see that it fails at the first read from src which contains the address 0x0000),
or walk up the stack using gdb’s up command to see what part of our code led to this situation.
To learn more about using gdb to debug native executables see
here.
Frequently Asked Questions
Why is the process of generating a native executable slow?
Native executable generation is a multi-step process. The analysis and compile steps are the most expensive of all and hence the ones that dominate the time spent generating the native executable.
In the analysis phase, a static points-to analysis starts from the main method of the program to find out what is reachable. As new classes are discovered, some of them will be initialized during this process depending on the configuration. In the next step, the heap is snapshotted and checks are made to see which types need to be available at runtime. The initialization and heap snapshotting can cause new types to be discovered, in which case the process is repeated. The process stops when a fixed point is reached, that is when the reachable program grows no more.
The compilation step is pretty straightforward, it simply compiles all the reachable code.
The time spent in analysis and compilation phases depends on how big the application is. The bigger the application, the longer it takes to compile it. However, there are certain features that can have an exponential effect. For example, when registering types and methods for reflection access, the analysis can’t easily see what’s behind those types or methods, so it has to do more work to complete the analysis step.
Why is runtime performance of a native executable inferior compared to JVM mode?
As with most things in life there are some trade offs involved when choosing native compilation over JVM mode. So depending on the application the runtime performance of a native application might be slower compared to JVM mode, though that’s not always the case.
JVM execution of an application includes runtime optimization of the code that profits from profile information built up during execution. That includes the opportunities to inline a lot more of the code, locate hot code on direct paths (i.e. ensure better instruction cache locality) and cut out a lot of the code on cold paths (on the JVM a lot of code does not get compiled until something tries to execute it — it is replaced with a trap that causes deoptimization and recompilation). Removal of cold paths provides many more optimization opportunities than are available for ahead of time compilation because it significantly reduces the branch complexity and combinatorial logic of the smaller amount of hot code that is compiled.
By contrast, native executable compilation has to cater for all possible execution paths when it compiles code offline since it does not know which are the hot or cold paths and cannot use the trick of planting a trap and recompiling if it is hit. For the same reason it cannot load the dice to ensure that code cache conflicts are minimized by co-locating hot paths adjacent. Native executable generation is able to remove some code because of the closed world hypothesis but that is often not enough to make up for all the benefits that profiling and runtime deopt & recompile provides to the JVM JIT compiler.
Note, however, that there is a price you pay for that potentially higher JVM speed, and that price is in increased resource usage (both CPU and memory) and startup time because:
-
it takes some time before the JIT kicks in and fully optimizes the code.
-
the JIT compiler consumes resources that could be utilized by the application.
-
the JVM has to retain a lot more metadata and compiler/profiler data to support the better optimizations that it can offer.
The reason for 1) is that code needs to be run interpreted for some time and, possibly, to be compiled several times before all potential optimizations are realized to ensure that:
-
it’s worth compiling that code path, i.e. it’s being executed enough times, and that
-
we have enough profiling data to perform meaningful optimizations.
An implication of 1) is that for small, short-lived applications a native executable may well be a better bet. Although the compiled code is not as well optimized it is available straight away.
The reason for 2) is that the JVM is essentially running the compiler at runtime in parallel with the application itself. In the case of native executables the compiler is run ahead of time removing the need to run the compiler in parallel with the application.
There are several reasons for 3). The JVM does not have a closed world assumption. So, it has to be able to recompile code if loading of new classes implies that it needs to revise optimistic assumptions made at compile time. For example, if an interface has only one implementation it can make a call jump directly to that code. However, in the case where a second implementation class is loaded the call site needs to be patched to test the type of the receiver instance and jump to the code that belongs to its class. Supporting optimizations like this one requires keeping track of a lot more details of the class base than a native executable, including recording the full class and interface hierarchy, details of which methods override other methods, all method bytecode etc. In a native executable most of the details of class structure and bytecode can be ignored at run time.
The JVM also has to cope with changes to the class base or execution profiles that result in a thread going down a previously cold path. At that point the JVM has to jump out of the compiled code into the interpreter and recompile the code to cater for a new execution profile that includes the previously cold path. That requires keeping runtime info that allow a compiled stack frame to be replaced with one or more interpreter frames. It also requires runtime extensible profile counters to be allocated and updated to track what has or has not been executed.
Why are native executables “big”?
This can be attributed to a number of different reasons:
-
Native executables include not only the application code but also, library code, and JDK code. As a result a more fair comparison would be to compare the native executable’s size with the size of the application, plus the size of the libraries it uses, plus the size of the JDK. Especially the JDK part is not negligible even in simple applications like HelloWorld. To get a glance on what is being pulled in the image one can use
-H:+PrintUniversewhen building the native executable. -
Some features are always included in a native executable even though they might never be actually used at run time. An example of such a feature is garbage collection. At compile time we can’t be sure whether an application will need to run garbage collection at run time, so garbage collection is always included in native executables increasing their size even if not necessary. Native executable generation relies on static code analysis to identify which code paths are reachable, and static code analysis can be imprecise leading to more code getting into the image than what’s actually needed.
There is a GraalVM upstream issue with some interesting discussions about that topic.
What version of Mandrel was used to generate a binary?
One can see which Mandrel version was used to generate a binary by inspecting the binary as follows:
$ strings target/debugging-native-1.0.0-SNAPSHOT-runner | grep GraalVM
com.oracle.svm.core.VM=GraalVM 22.0.0.2-Final Java 11 Mandrel Distribution
How do I enable GC logging in native executables?
Executing the native executable with -XX:PrintFlags= prints a list of flags that can be passed to native executables.
For various levels of GC logging one may use:
$ ./target/debugging-native-1.0.0-SNAPSHOT-runner -XX:PrintFlags=
...
  -XX:±PrintGC                                 Print summary GC information after each collection. Default: - (disabled).
  -XX:±PrintGCSummary                          Print summary GC information after application main method returns. Default: - (disabled).
  -XX:±PrintGCTimeStamps                       Print a time stamp at each collection, if +PrintGC or +VerboseGC. Default: - (disabled).
  -XX:±PrintGCTimes                            Print the time for each of the phases of each collection, if +VerboseGC. Default: - (disabled).
  -XX:±PrintHeapShape                          Print the shape of the heap before and after each collection, if +VerboseGC. Default: - (disabled).
...
  -XX:±TraceHeapChunks                         Trace heap chunks during collections, if +VerboseGC and +PrintHeapShape. Default: - (disabled).
  -XX:±VerboseGC                               Print more information about the heap before and after each collection. Default: - (disabled).
Can I get a heap dump of a native executable? e.g. if it runs out of memory
Unfortunately generating heap dumps in hprof format, which can be opened by tools such as VisualVM or Eclipse MAT, can only be achieved with GraalVM Enterprise Edition. Mandrel, which is based on the GraalVM Community Edition, does not have this capability.
Although Mandrel can generate debug symbols and these contain a fair amount of information about object layouts, including what is a pointer field vs a primitive field, this information cannot be used as is to detect memory leaks or find dominator objects. This is because it has no idea what constitutes a root pointer nor how to recursively trace pointers from those roots.
Can I build and run this examples outside of a container in Linux?
Yes you can.
In fact, debugging native executables on a Linux bare metal box offers the best possible experience.
In this kind of environments, root access is not needed except to install packages required to run some debug steps,
or to enable perf to gather events at the kernel.
These are the packages you’ll need on your Linux environment to run through the different debugging sections:
# dnf (rpm-based)
sudo dnf install binutils gdb perf perl-open
# Debian-based distributions:
sudo apt install binutils gdb perf
Generating flame graphs is slow, or produces errors, what can I do?
There are multiple ways in which a native executable produced by Mandrel can be profiled.
All the methods require you to pass in the -H:-DeleteLocalSymbols option.
The method shown in this reference guide generates a binary with DWARF debug information,
runs it via perf record and then uses perf script and flame graph tooling to generate the flamegraphs.
However, the perf script post-processing step done on this binary can appear to be slow or can show some DWARF errors.
An alternative method to generate flame graphs is to pass in -H:+PreserveFramePointer when generating the native executable instead of generating the DWARF debug information.
It instructs the binary to use an extra register for the frame pointer.
This enables perf to do stack walking to profile the runtime behaviour.
To generate the native executable using these flags, do the following:
./mvnw package -DskipTests -Pnative
    -Dquarkus.native.additional-build-args=-H:+PreserveFramePointer,-H:-DeleteLocalSymbols
To get runtime profiling information out of the native executable, simply do:
perf record -F 1009 -g -a ./target/debugging-native-1.0.0-SNAPSHOT-runnerThe recommended method for generating runtime profiling information is using the debug information rather than generating a binary that preserves the frame pointer. This is because adding debug information to the native executable build process has no negative runtime performance whereas preserving the frame pointer does.
DWARF debug info is generated in a separate file and can even be omitted in the default deployment and only be transferred and used on demand,
for profiling or debugging purposes.
Furthermore, the presence of debug info enables perf to show us the relevant source code lines as well,
hence it does not bloat the native executable itself.
To do that, simply call perf report with an extra parameter to show source code lines:
perf report --stdio -F+srcline
...
83.69%     0.00%  GreetingResource.java:20 ...
...
83.69%     0.00%  AbstractStringBuilder.java:1025 ...
...
83.69%     0.00%  ArraycopySnippets.java:95 ...
The performance penalty of preserving the frame pointer is due to using the extra register for stack walking,
particularly in x86_64 compared to aarch64 where there are less registers available.
Using this extra register reduces the number of registers that are available for other work,
which can lead to performance penalties.
I think I’ve found a bug in native-image, how can I debug it with the IDE?
Although it is possible to remote debug processes within containers, it might be easier to step-by-step debug native-image by installing Mandrel locally and adding it to the path of the shell process.
Native executable generation is the result of two Java processes that are executed sequentially. The first process is very short and its main job is to set things up for the second process. The second process is the one that takes care of most of the work. The steps to debug one process or the other vary slightly.
Let’s discuss first how to debug the second process,
which is the one you most likely to want to debug.
The starting point for the second process is the com.oracle.svm.hosted.NativeImageGeneratorRunner class.
To debug this process, simply add --debug-attach=*:8000 as an additional build time argument:
./mvnw package -DskipTests -Pnative \
    -Dquarkus.native.additional-build-args=--debug-attach=*:8000
The starting point for the first process is the com.oracle.svm.driver.NativeImages class.
In GraalVM CE distributions, this first process is a binary, so debugging it in the traditional way with a Java IDE is not possible.
However, Mandrel distributions (or locally built GraalVM CE instances) keep this as a normal Java process,
so you can remote debug this process by adding the --vm.agentlib:jdwp=transport=dt_socket,server=y,suspend=y,address=*:8000 as an additional build argument, e.g.
$ ./mvnw package -DskipTests -Pnative \
    -Dquarkus.native.additional-build-args=--vm.agentlib:jdwp=transport=dt_socket\\,server=y\\,suspend=y\\,address=*:8000
Can I use JFR/JMC to debug or profile native binaries?
Java Flight Recorder (JFR) and JDK Mission Control (JMC) can be used to profile native binaries since GraalVM CE 21.2.0. However, JFR in GraalVM is currently significantly limited in capabilities compared to HotSpot. The custom event API is fully supported, but many VM level features are unavailable. They will be added in future releases. Current limitations are:
-
Minimal VM level events
-
No old object sampling
-
No stacktrace tracing
-
No Streaming API for JDK 17
To use JFR add the application property: -Dquarkus.native.enable-vm-inspection=true.
E.g.
./mvnw package -DskipTests -Pnative -Dquarkus.native.container-build=true \
    -Dquarkus.native.builder-image=quay.io/quarkus/ubi-quarkus-mandrel:22.0-java11 \
    -Dquarkus.native.enable-vm-inspection=true
Once the image is compiled, enable and start JFR via runtime flags: -XX:+FlightRecorder and -XX:StartFlightRecording. For example:
./target/debugging-native-1.0.0-SNAPSHOT-runner \
    -XX:+FlightRecorder \
    -XX:StartFlightRecording="filename=recording.jfr"
For more details on using JFR, see here.